


ABSTRACT
Water is a major input in agriculture and its relative availability in requisite quality in different agro climatic zones calls for efficient water resource development plans. Ground water constitutes the main source of irrigation in many parts of Haryana. The study was conducted in ten micro-watersheds falling under rainfed area in Mahendergarh District. Geo-informatics techniques in combination with ground data was used for identification, demarcation and preparation of ground water quality maps. Water samples were collected from the running tube wells of the study area and locations of sampling sites were recorded in the form of latitude &longitude using handheld Global Positioning System (GPS). These collected water samples were analyzed for their E.C., pH, Ca2+, Mg2+, HCO3- and CO32-. These waters were classified as per the established methodolgy. It was observed that good quality waters occupied an area of 60.81% of total geographical area of all the microwatersheds. Sodic water mainly found in Khudana –V, or Adalpur micro-watershed.
INTRODUCTION
Water is conceived to be most precious natural resource on earth. It is directly linked with agricultural productivity and protection or development of human needs. The Sub-Surface water quantity and quality both are important for long time irrigation activities or for drinking purposes. This needs detailed information on land and water resources and agriculture in the region for meticulous planning of strategies and effective implementation. There is a close relationship between water scarcity and reduced food productivity, mainlyapplicable in rain fed areas of the country. So the management of water is essential for drinking as well as irrigation purpose (ENVIS Newsletter, 2008). The most common standards used to assess water quality relate to drinking water, safety of human contact and for health of ecosystems. Gayananath et. al. 2001 also assessed environmental parameters on groundwater quality. Remesan & Panda, 2008 prepared water quality and riskzone mapping using remote sensing and geographical information system (GIS). An understanding of the various factors influencing water quality is thus very important as human health is largely dependent on the quality of water available for use.
Watersheds are natural hydrological entities that cover a specific aerial expanse of land surface from which the rainfall runoff flows to a defined drain, channel, stream or river at any particular point. The terms basin, catchment, watershed etc. are widely used to denote hydrological units (Watershed Atlas of India, 1990). The watershed area is therefore an ideal water management unit. High resolution satellite data and GIS techniques were also used for sustainable development in semi-arid regions on micro-watershed basis (Arya et.al.2010). Hence the size of a watershed is governed by the size of the streams occupied by it.
Remote sensing, Geographical Information System (GIS) and Global Positioning System (GPS) techniques have capability to provide reliable information for spatial planning’s. The synoptic large area repetitive Coverage provided by satellite sensors can provide appropriate data base for water and watershed management Practices.
STUDY AREA
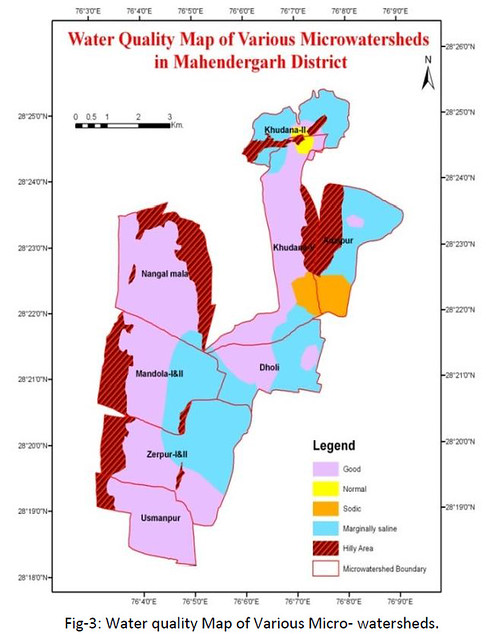
The study area comprises of ten micro- watersheds of Mahendergarh district in Haryana viz. Nangal Mala, Usmanpur, Zerpur-I&II, Mandola-I&II, Adalpur, Dholi, Khudana-II, Khudana-V located between 280 18’ 0” N to 280 25’30”N and 760 30’ E to 760 9’ 15”E covering an area of 5585.64 ha as shown in Figure-1.
Mahendergarh District is situated in south-western part of Haryana, has an area of 1899 sq.km. Geographically it is bordered by Bhiwani district in north, Rewari district in east, Alwar, Jaipur and Sikar in south and in west by Sikar and JhunJhunu district of Rajasthan State.
PHYSICAL DESCRIPTION
 The district is dominated by dry lands with presence of inland streams, sandy plains, shifting sand dunes, stabilized sand dunes, dissected uplands tracks and often barren, denuded, rocky hill ranges and their outcrops, consequently, the overall relief are undulating with a regional slope from north to northeast. Area covered with sandy plains encloses western &
The drainage of the district comprises seasonal streams Dohan & Krishnawati make irregular flood plains. These streams are active only during the rainy season. The seasonal flowing of Dohan & Krishnawati periodically raises the fresh quality water. It also helps base flow during early part of the dry season.
The climate conditions in the district vary from arid to semi-arid .The summer months are very hot whereas winter season is fairly cool & dry during the months of December & January. Occasionally, frost also occurs in winter. The average annual rainfall ofthe district is 499mm. About 75% of rainfall is received during the south-west monsoon months i.e. July to September. July & August are the rainiest months in the year.
Temperature begins to rise from March to June. The mean daily maximum temperature is about 450C. This may go up to 480C. After October, there is decrease in both day & night temperature. January is the coldest month with daily mean temperature of 110C.
MATERIALS AND METHODOLOGY
The Indian Remote Sensing Satellite data (IRS-P6, LISS-IV) was used for the study. Satellite sensor or sensor specifications and acquisition dates for the data used during the analysis are given in table-1 and table- 2.
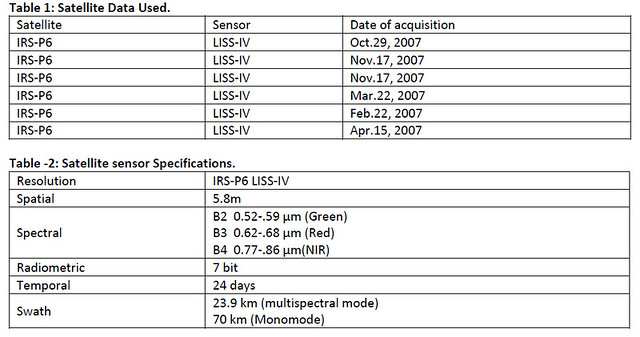
Ancillary Data
Survey of India Topographical Sheets: 53D/3, 53D/4, 54 A/1 on 1:50,000 scale.
Microwatershed boundary maps were collected from Department of Agriculture, Haryana.
Software Used
ERDAS IMAGINE-9.3, ARC/MAP-9.3, and handheld GARMIN-72 GPS.
Satellite data used for the study was geo-referenced and the vector layers of micro-watersheds boundaries were overlaid on the satellite image. A detailed ground water quality survey was also conducted.
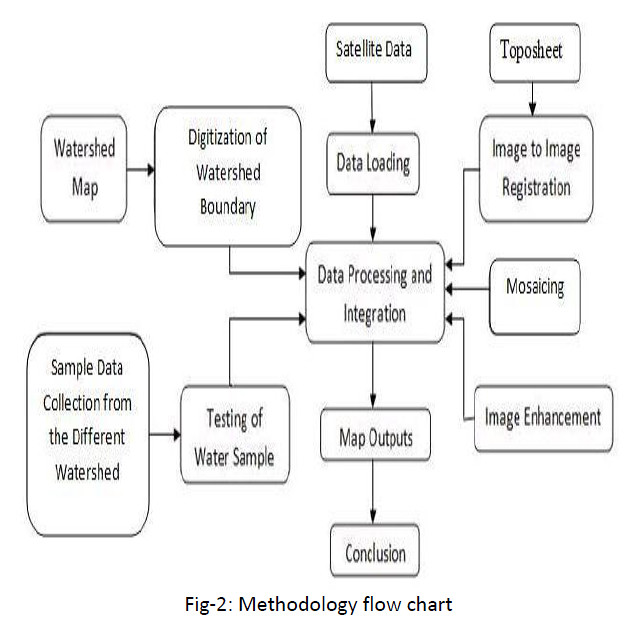 Total 29 Ground water samples from operational tube wells representing different micro-watersheds were collected. GPS locations in the form of latitudes &
RESULTS AND DISCUSSION
The collected/tested water samples were classified after analyzing their chemical properties into different quality classes. The water quality classes along with their locations are given in table-4. Brief description of various classes is given below and their areal extent is shown in table-5.
Good: This quality of ground water was found in nine microwatersheds. It covered an area of 3396.67 ha and constitutes 60.81% of the total area of all the microwatersheds. These waters are fit for irrigating all agricultural crops as well as for drinking purposes for human and animals.
 Normal: This class occupied an area of 40.34 ha in Khudana-IV, Khudana-V, Microwatersheds. It constitutes 0.72 % of the total study area. These waters can also be used for agriculture as well as drinking purposes. As the electrical conductivity is more than 2 so these waters can be harmful for the salt sensitive crops.
Sodic: Sodic water was found in khudana –V and Adalpur microwatersheds covering an area of 182.24ha which is 3.26 % of the study area. These waters are very harmful to crops as well as for soils. These are unfit for irrigation and should not be used for any purposes.
Marginal saline: This category occupied an area of 1966.38 ha and constitutes 35.20 % of the study area. It was mainly found in Mandola-I&II, Zerpur- I&II, Dholi, Adalpur or Kudana-II microwatersheds. These waters can be used after mixing with canal water and in sandy soils.
CONCLUSIONS
The ground water quality maps of these microwatersheds can be very useful for micro-level planning. The saline and sodic waters should not be used for irrigation as they will degrade the soils of concerned microwatersheds. Based on the information generated along with the soil information, the crops can be suggested to the farmers of that area.
REFERENCES
- Arya, V.S., Raj Kumar and Hooda. R.S., 2010. Evaluation and geo-database creation of watersheds -Case study in Siwaliks, Haryana. Current Science, Vol.98, No.9, pp.1219-1223.
- ENVIS Newsletter, 2008. Water Quality Management in India. Volume1, 1.
- Gyananath, G.; Islam, S.R.; Shewdikar, S.V, 2001. Assessment of Environmental Parameter on ground water quality. Indian Journal of Environmental Protection. 2001, 21, 289-294.
- Renji Remesan and R.K Panda, 2008. Remote sensing and GIS application for groundwater quality and risk mapping. 3rd International Conference on Water Resources and Arid Environments and the 1st Arab Water Forum.
- Watershed Atlas of India, AISLUS, 1990.
Arya,V.S. Saini Aakash, Hardev Singh & Hooda,R.S.
Haryana Space Applications Centre (HARSAC), CCS HAU Campus
Posted by


